%matplotlib inline
import pandas as pd

import matplotlib.pyplot as plt
# Setting this here avoids the issue with the color_cycle error if the older method is used
plt.style.use('ggplot')

import numpy as np

#pd.set_option('display.mpl_style', 'default') # use plt.style.use instead
plt.rcParams['figure.figsize'] = (15, 3)
plt.rcParams['font.family'] = 'sans-serif'
Overview
This is a sample notebook to show how you can create a dynamic document that reworks itself if the data changes. Note that this is not a Microsoft Office. At the end of this talk, we are going to have a document with updated data, new charts and tables, as well as a saved dataset or two.
We’ll do this by downloading Environment Canada data one month at a time, performing some functions on it and then combining all the months together.
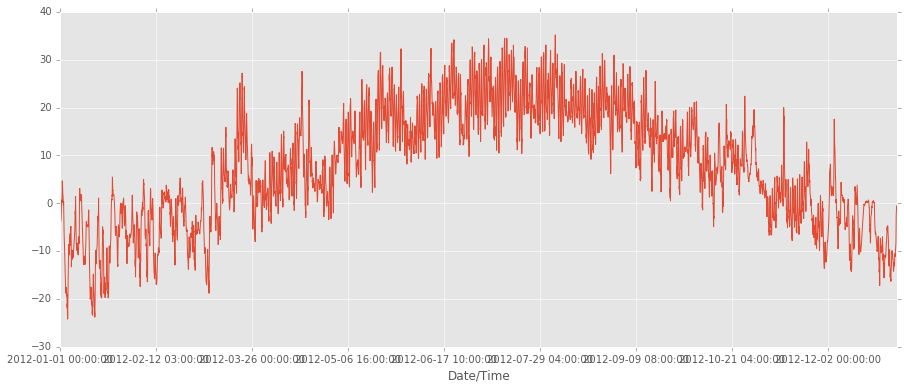
Here’s the temperature every hour for 2012. It is not pretty, but it is mostly readable. The x-axis needs some work, but this is literally done using all defaults.
ott_weather_2012_final = pd.read_csv('./data/ott_weather_2012.csv', index_col='Date/Time', encoding='latin1')
chart = ott_weather_2012_final['Temp (C)'].plot(figsize=(15, 6))
chart.set_xlabel("Date/Time")
<matplotlib.text.Text at 0x106e1ed90>
One month of weather data
When using the data in my previous talk, I loaded it into an RRD. For anyone who is familiar with RRD, it is a fixed size and lossy storage format. You you lose detail over time and data stored values can average across readings. It is good for trending, but not for anything requiring exact numbers.
In this case, we have complete data (well, as complete as it gets). First we are going to look at the hourly temperatures for Ottawa. Environment Canada makes it easy to download data, but it uses a web interface. If you play with it for a bit, you can see the pattern in the request URL and automate from there.
Ottawa is station id 49568.
The following is a template we can use for fetching specific months in a year. We could even allow for the choice of station to make it more flexible, but that is not really necessary here.
url_template = ("http://climate.weather.gc.ca/climateData/bulkdata_e.html?"
               "format=csv&stationID=49568&Year={year}&Month={month}&"
               "timeframe=1&submit=Download+Data")
In order to download data for the month of March in 2012, we need to specify month=3, year=2012 using the format function.
url = url_template.format(month=3, year=2012)
If you have used R, you are familiar with reading from a URL as well as a file. Pandas has that capability also.
Just use the same read_csv function as before with the URL instead of the filename, and just give it a URL as a filename.
There are 16 rows of metadata at the top of this CSV, you need to have looked at it before trying this in order to isolate the actual data from the rest of the explanation. In this case we need to skip over 16 rows to get to the data. There is no extra junk at the bottom we need to ignore, so we have a simple import. Since pandas understands the CSV format and that there are irregularities in the files, there is a skiprows option. Our options will be to parse the dates again, and set ‘Date/Time’ to be the index column.
ott_weather_mar2012 = pd.read_csv(url, skiprows=15, index_col='Date/Time', parse_dates=True, encoding='latin1')
Here’s the resulting dataframe.
ott_weather_mar2012
| Year | Month | Day | Time | Data Quality | Temp (°C) | Temp Flag | Dew Point Temp (°C) | Dew Point Temp Flag | Rel Hum (%) | ... | Wind Spd Flag | Visibility (km) | Visibility Flag | Stn Press (kPa) | Stn Press Flag | Hmdx | Hmdx Flag | Wind Chill | Wind Chill Flag | Weather | |
|---|---|---|---|---|---|---|---|---|---|---|---|---|---|---|---|---|---|---|---|---|---|
| Date/Time | |||||||||||||||||||||
| 2012-03-01 00:00:00 | 2012 | 3 | 1 | 00:00 | Â | -6.2 | NaN | -8.0 | NaN | 87 | ... | NaN | 2.4 | NaN | 99.59 | NaN | NaN | NaN | -15 | NaN | Snow,Blowing Snow |
| 2012-03-01 01:00:00 | 2012 | 3 | 1 | 01:00 | Â | -6.1 | NaN | -7.6 | NaN | 89 | ... | NaN | 1.6 | NaN | 99.51 | NaN | NaN | NaN | -15 | NaN | Snow,Blowing Snow |
| 2012-03-01 02:00:00 | 2012 | 3 | 1 | 02:00 | Â | -6.2 | NaN | -7.7 | NaN | 89 | ... | NaN | 1.6 | NaN | 99.36 | NaN | NaN | NaN | -15 | NaN | Snow,Blowing Snow |
| 2012-03-01 03:00:00 | 2012 | 3 | 1 | 03:00 | Â | -6.2 | NaN | -7.9 | NaN | 88 | ... | NaN | 3.2 | NaN | 99.31 | NaN | NaN | NaN | -15 | NaN | Snow,Blowing Snow |
| 2012-03-01 04:00:00 | 2012 | 3 | 1 | 04:00 | Â | -6.3 | NaN | -7.8 | NaN | 89 | ... | NaN | 8.1 | NaN | 99.27 | NaN | NaN | NaN | -14 | NaN | Snow,Blowing Snow |
| 2012-03-01 05:00:00 | 2012 | 3 | 1 | 05:00 | Â | -6.0 | NaN | -7.2 | NaN | 91 | ... | NaN | 6.4 | NaN | 99.26 | NaN | NaN | NaN | -14 | NaN | Freezing Drizzle,Ice Pellets |
| 2012-03-01 06:00:00 | 2012 | 3 | 1 | 06:00 | Â | -5.6 | NaN | -7.0 | NaN | 90 | ... | NaN | 9.7 | NaN | 99.19 | NaN | NaN | NaN | -14 | NaN | Freezing Drizzle |
| 2012-03-01 07:00:00 | 2012 | 3 | 1 | 07:00 | Â | -5.8 | NaN | -7.6 | NaN | 87 | ... | NaN | 10.0 | NaN | 99.20 | NaN | NaN | NaN | -15 | NaN | Blowing Snow |
| 2012-03-01 08:00:00 | 2012 | 3 | 1 | 08:00 | Â | -5.8 | NaN | -7.5 | NaN | 88 | ... | NaN | 10.0 | NaN | 99.22 | NaN | NaN | NaN | -15 | NaN | Blowing Snow |
| 2012-03-01 09:00:00 | 2012 | 3 | 1 | 09:00 | Â | -5.7 | NaN | -7.2 | NaN | 89 | ... | NaN | 2.8 | NaN | 99.25 | NaN | NaN | NaN | -14 | NaN | Snow,Fog,Blowing Snow |
| 2012-03-01 10:00:00 | 2012 | 3 | 1 | 10:00 | Â | -5.7 | NaN | -7.4 | NaN | 88 | ... | NaN | 1.6 | NaN | 99.28 | NaN | NaN | NaN | -14 | NaN | Snow,Fog,Blowing Snow |
| 2012-03-01 11:00:00 | 2012 | 3 | 1 | 11:00 | Â | -5.5 | NaN | -7.3 | NaN | 87 | ... | NaN | 1.6 | NaN | 99.32 | NaN | NaN | NaN | -14 | NaN | Snow,Fog,Blowing Snow |
| 2012-03-01 12:00:00 | 2012 | 3 | 1 | 12:00 | Â | -4.9 | NaN | -6.9 | NaN | 86 | ... | NaN | 4.8 | NaN | 99.34 | NaN | NaN | NaN | -13 | NaN | Snow,Fog,Blowing Snow |
| 2012-03-01 13:00:00 | 2012 | 3 | 1 | 13:00 | Â | -4.4 | NaN | -6.3 | NaN | 87 | ... | NaN | 1.6 | NaN | 99.34 | NaN | NaN | NaN | -12 | NaN | Snow,Fog,Blowing Snow |
| 2012-03-01 14:00:00 | 2012 | 3 | 1 | 14:00 | Â | -3.9 | NaN | -6.1 | NaN | 85 | ... | NaN | 4.8 | NaN | 99.36 | NaN | NaN | NaN | -12 | NaN | Snow,Fog,Blowing Snow |
| 2012-03-01 15:00:00 | 2012 | 3 | 1 | 15:00 | Â | -4.3 | NaN | -6.6 | NaN | 84 | ... | NaN | 10.0 | NaN | 99.42 | NaN | NaN | NaN | -13 | NaN | Snow,Blowing Snow |
| 2012-03-01 16:00:00 | 2012 | 3 | 1 | 16:00 | Â | -4.7 | NaN | -7.0 | NaN | 84 | ... | NaN | 10.0 | NaN | 99.47 | NaN | NaN | NaN | -13 | NaN | Snow,Blowing Snow |
| 2012-03-01 17:00:00 | 2012 | 3 | 1 | 17:00 | Â | -4.7 | NaN | -6.9 | NaN | 85 | ... | NaN | 10.0 | NaN | 99.54 | NaN | NaN | NaN | -13 | NaN | Blowing Snow |
| 2012-03-01 18:00:00 | 2012 | 3 | 1 | 18:00 | Â | -5.2 | NaN | -7.0 | NaN | 87 | ... | NaN | 10.0 | NaN | 99.66 | NaN | NaN | NaN | -13 | NaN | Snow,Blowing Snow |
| 2012-03-01 19:00:00 | 2012 | 3 | 1 | 19:00 | Â | -5.4 | NaN | -7.2 | NaN | 87 | ... | NaN | 10.0 | NaN | 99.71 | NaN | NaN | NaN | -12 | NaN | Snow,Blowing Snow |
| 2012-03-01 20:00:00 | 2012 | 3 | 1 | 20:00 | Â | -5.4 | NaN | -7.1 | NaN | 88 | ... | NaN | 6.4 | NaN | 99.72 | NaN | NaN | NaN | -13 | NaN | Snow,Blowing Snow |
| 2012-03-01 21:00:00 | 2012 | 3 | 1 | 21:00 | Â | -5.4 | NaN | -7.1 | NaN | 88 | ... | NaN | 10.0 | NaN | 99.82 | NaN | NaN | NaN | -12 | NaN | Snow,Blowing Snow |
| 2012-03-01 22:00:00 | 2012 | 3 | 1 | 22:00 | Â | -5.5 | NaN | -7.2 | NaN | 88 | ... | NaN | 4.8 | NaN | 99.88 | NaN | NaN | NaN | -13 | NaN | Snow,Blowing Snow |
| 2012-03-01 23:00:00 | 2012 | 3 | 1 | 23:00 | Â | -5.5 | NaN | -7.2 | NaN | 88 | ... | NaN | 4.8 | NaN | 99.89 | NaN | NaN | NaN | -12 | NaN | Freezing Drizzle,Snow |
| 2012-03-02 00:00:00 | 2012 | 3 | 2 | 00:00 | Â | -5.6 | NaN | -7.1 | NaN | 89 | ... | NaN | 9.7 | NaN | 99.93 | NaN | NaN | NaN | -11 | NaN | Snow |
| 2012-03-02 01:00:00 | 2012 | 3 | 2 | 01:00 | Â | -5.7 | NaN | -7.2 | NaN | 89 | ... | NaN | 10.0 | NaN | 100.01 | NaN | NaN | NaN | -10 | NaN | Snow |
| 2012-03-02 02:00:00 | 2012 | 3 | 2 | 02:00 | Â | -5.8 | NaN | -7.3 | NaN | 89 | ... | NaN | 6.4 | NaN | 100.08 | NaN | NaN | NaN | -9 | NaN | Freezing Drizzle,Snow Grains |
| 2012-03-02 03:00:00 | 2012 | 3 | 2 | 03:00 | Â | -5.9 | NaN | -7.3 | NaN | 90 | ... | NaN | 10.0 | NaN | 100.06 | NaN | NaN | NaN | -10 | NaN | Freezing Drizzle,Snow Grains |
| 2012-03-02 04:00:00 | 2012 | 3 | 2 | 04:00 | Â | -6.1 | NaN | -7.6 | NaN | 89 | ... | NaN | 10.0 | NaN | 100.09 | NaN | NaN | NaN | -11 | NaN | Snow |
| 2012-03-02 05:00:00 | 2012 | 3 | 2 | 05:00 | Â | -6.3 | NaN | -7.8 | NaN | 89 | ... | NaN | 10.0 | NaN | 100.08 | NaN | NaN | NaN | -11 | NaN | NaN |
| ... | ... | ... | ... | ... | ... | ... | ... | ... | ... | ... | ... | ... | ... | ... | ... | ... | ... | ... | ... | ... | ... |
| 2012-03-30 18:00:00 | 2012 | 3 | 30 | 18:00 | Â | 2.5 | NaN | -11.1 | NaN | 36 | ... | NaN | 10.0 | NaN | 100.32 | NaN | NaN | NaN | NaN | NaN | NaN |
| 2012-03-30 19:00:00 | 2012 | 3 | 30 | 19:00 | Â | 2.0 | NaN | -10.9 | NaN | 38 | ... | NaN | 10.0 | NaN | 100.33 | NaN | NaN | NaN | NaN | NaN | Mostly Cloudy |
| 2012-03-30 20:00:00 | 2012 | 3 | 30 | 20:00 | Â | 1.4 | NaN | -10.2 | NaN | 42 | ... | NaN | 10.0 | NaN | 100.36 | NaN | NaN | NaN | NaN | NaN | NaN |
| 2012-03-30 21:00:00 | 2012 | 3 | 30 | 21:00 | Â | 0.9 | NaN | -10.0 | NaN | 44 | ... | NaN | 10.0 | NaN | 100.36 | NaN | NaN | NaN | NaN | NaN | NaN |
| 2012-03-30 22:00:00 | 2012 | 3 | 30 | 22:00 | Â | 0.7 | NaN | -10.2 | NaN | 44 | ... | NaN | 10.0 | NaN | 100.37 | NaN | NaN | NaN | NaN | NaN | Mainly Clear |
| 2012-03-30 23:00:00 | 2012 | 3 | 30 | 23:00 | Â | 0.1 | NaN | -9.7 | NaN | 48 | ... | NaN | 10.0 | NaN | 100.34 | NaN | NaN | NaN | NaN | NaN | NaN |
| 2012-03-31 00:00:00 | 2012 | 3 | 31 | 00:00 | Â | -0.4 | NaN | -9.4 | NaN | 51 | ... | NaN | 10.0 | NaN | 100.29 | NaN | NaN | NaN | -5 | NaN | NaN |
| 2012-03-31 01:00:00 | 2012 | 3 | 31 | 01:00 | Â | -0.4 | NaN | -9.1 | NaN | 52 | ... | NaN | 10.0 | NaN | 100.30 | NaN | NaN | NaN | -5 | NaN | Mostly Cloudy |
| 2012-03-31 02:00:00 | 2012 | 3 | 31 | 02:00 | Â | -0.4 | NaN | -8.6 | NaN | 54 | ... | NaN | 10.0 | NaN | 100.26 | NaN | NaN | NaN | -5 | NaN | NaN |
| 2012-03-31 03:00:00 | 2012 | 3 | 31 | 03:00 | Â | -0.4 | NaN | -8.4 | NaN | 55 | ... | NaN | 10.0 | NaN | 100.29 | NaN | NaN | NaN | -5 | NaN | NaN |
| 2012-03-31 04:00:00 | 2012 | 3 | 31 | 04:00 | Â | -0.6 | NaN | -8.3 | NaN | 56 | ... | NaN | 10.0 | NaN | 100.25 | NaN | NaN | NaN | -6 | NaN | Mostly Cloudy |
| 2012-03-31 05:00:00 | 2012 | 3 | 31 | 05:00 | Â | -0.8 | NaN | -8.5 | NaN | 56 | ... | NaN | 10.0 | NaN | 100.23 | NaN | NaN | NaN | -6 | NaN | NaN |
| 2012-03-31 06:00:00 | 2012 | 3 | 31 | 06:00 | Â | -0.9 | NaN | -8.9 | NaN | 55 | ... | NaN | 10.0 | NaN | 100.26 | NaN | NaN | NaN | -6 | NaN | NaN |
| 2012-03-31 07:00:00 | 2012 | 3 | 31 | 07:00 | Â | -0.2 | NaN | -8.9 | NaN | 52 | ... | NaN | 10.0 | NaN | 100.31 | NaN | NaN | NaN | -5 | NaN | Mostly Cloudy |
| 2012-03-31 08:00:00 | 2012 | 3 | 31 | 08:00 | Â | 1.9 | NaN | -8.8 | NaN | 45 | ... | NaN | 10.0 | NaN | 100.32 | NaN | NaN | NaN | NaN | NaN | NaN |
| 2012-03-31 09:00:00 | 2012 | 3 | 31 | 09:00 | Â | 3.3 | NaN | -9.1 | NaN | 40 | ... | NaN | 10.0 | NaN | 100.30 | NaN | NaN | NaN | NaN | NaN | NaN |
| 2012-03-31 10:00:00 | 2012 | 3 | 31 | 10:00 | Â | 5.1 | NaN | -8.4 | NaN | 37 | ... | NaN | 10.0 | NaN | 100.27 | NaN | NaN | NaN | NaN | NaN | Mainly Clear |
| 2012-03-31 11:00:00 | 2012 | 3 | 31 | 11:00 | Â | 6.3 | NaN | -8.8 | NaN | 33 | ... | NaN | 10.0 | NaN | 100.23 | NaN | NaN | NaN | NaN | NaN | NaN |
| 2012-03-31 12:00:00 | 2012 | 3 | 31 | 12:00 | Â | 6.7 | NaN | -9.3 | NaN | 31 | ... | NaN | 10.0 | NaN | 100.18 | NaN | NaN | NaN | NaN | NaN | NaN |
| 2012-03-31 13:00:00 | 2012 | 3 | 31 | 13:00 | Â | 7.7 | NaN | -9.3 | NaN | 29 | ... | NaN | 10.0 | NaN | 100.10 | NaN | NaN | NaN | NaN | NaN | Clear |
| 2012-03-31 14:00:00 | 2012 | 3 | 31 | 14:00 | Â | 8.2 | NaN | -8.8 | NaN | 29 | ... | NaN | 10.0 | NaN | 100.00 | NaN | NaN | NaN | NaN | NaN | NaN |
| 2012-03-31 15:00:00 | 2012 | 3 | 31 | 15:00 | Â | 8.9 | NaN | -8.7 | NaN | 28 | ... | NaN | 10.0 | NaN | 99.95 | NaN | NaN | NaN | NaN | NaN | NaN |
| 2012-03-31 16:00:00 | 2012 | 3 | 31 | 16:00 | Â | 8.6 | NaN | -9.9 | NaN | 26 | ... | NaN | 10.0 | NaN | 99.91 | NaN | NaN | NaN | NaN | NaN | Mainly Clear |
| 2012-03-31 17:00:00 | 2012 | 3 | 31 | 17:00 | Â | 8.1 | NaN | -10.3 | NaN | 26 | ... | NaN | 10.0 | NaN | 99.89 | NaN | NaN | NaN | NaN | NaN | NaN |
| 2012-03-31 18:00:00 | 2012 | 3 | 31 | 18:00 | Â | 6.2 | NaN | -10.6 | NaN | 29 | ... | NaN | 10.0 | NaN | 99.92 | NaN | NaN | NaN | NaN | NaN | NaN |
| 2012-03-31 19:00:00 | 2012 | 3 | 31 | 19:00 | Â | 5.6 | NaN | -11.1 | NaN | 29 | ... | NaN | 10.0 | NaN | 99.91 | NaN | NaN | NaN | NaN | NaN | Clear |
| 2012-03-31 20:00:00 | 2012 | 3 | 31 | 20:00 | Â | 2.7 | NaN | -9.9 | NaN | 39 | ... | NaN | 10.0 | NaN | 99.91 | NaN | NaN | NaN | NaN | NaN | NaN |
| 2012-03-31 21:00:00 | 2012 | 3 | 31 | 21:00 | Â | 0.7 | NaN | -9.9 | NaN | 45 | ... | NaN | 10.0 | NaN | 99.91 | NaN | NaN | NaN | NaN | NaN | NaN |
| 2012-03-31 22:00:00 | 2012 | 3 | 31 | 22:00 | Â | 1.8 | NaN | -9.8 | NaN | 42 | ... | NaN | 10.0 | NaN | 99.84 | NaN | NaN | NaN | NaN | NaN | Clear |
| 2012-03-31 23:00:00 | 2012 | 3 | 31 | 23:00 | Â | 0.7 | NaN | -9.9 | NaN | 45 | ... | NaN | 10.0 | NaN | 99.82 | NaN | NaN | NaN | NaN | NaN | NaN |
744 rows × 24 columns
And since graphics are much more interesting than tables, lets plot it.
ott_weather_mar2012[u"Temp (\xc2\xb0C)"].plot(figsize=(15, 5))
<matplotlib.axes._subplots.AxesSubplot at 0x10d3f9490>
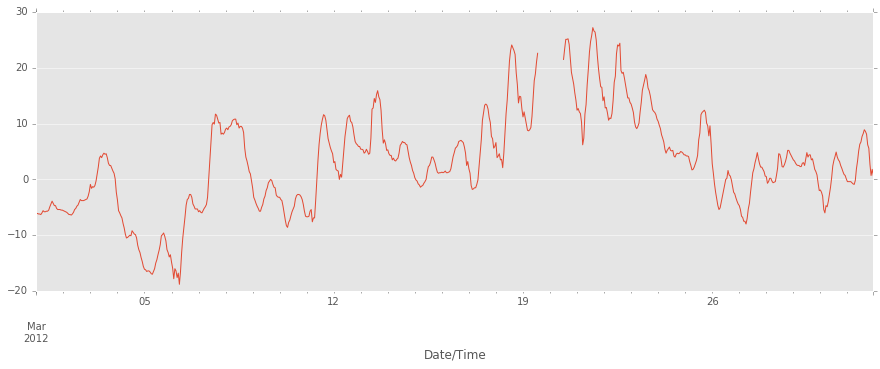
Notice how it goes up to above 25° C in the middle there? That was an interesting March. We can quickly look at March of 2013, 2014 and 2015 to compare it.
url = url_template.format(month=3, year=2013)
ott_weather_mar2013 = pd.read_csv(url, skiprows=15, index_col='Date/Time', parse_dates=True, encoding='latin1')
ott_weather_mar2013[u"Temp (\xc2\xb0C)"].plot(figsize=(15, 5))
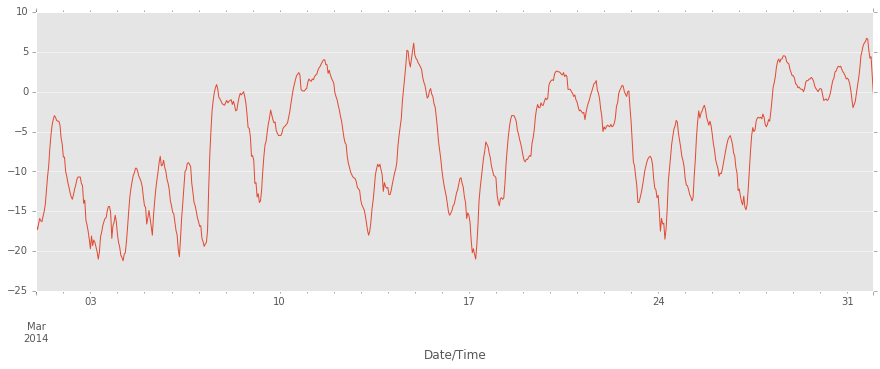
url = url_template.format(month=3, year=2014)
ott_weather_mar2014 = pd.read_csv(url, skiprows=15, index_col='Date/Time', parse_dates=True, encoding='latin1')
ott_weather_mar2014[u"Temp (\xc2\xb0C)"].plot(figsize=(15, 5))
url = url_template.format(month=3, year=2015)
ott_weather_mar2015 = pd.read_csv(url, skiprows=15, index_col='Date/Time', parse_dates=True, encoding='latin1')
ott_weather_mar2015[u"Temp (\xc2\xb0C)"].plot(figsize=(15, 5))
<matplotlib.axes._subplots.AxesSubplot at 0x11084a190>
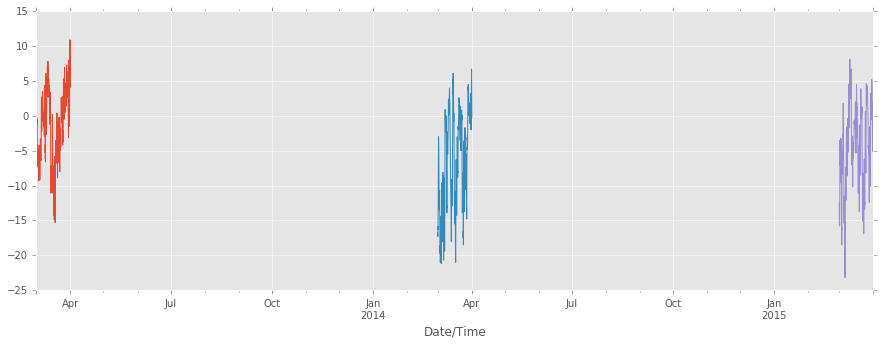
That didn’t work out too well, did it? I’m sure there is a way to show stacked plots, but our dates happen to be sequential and the x-axis allowed for that.
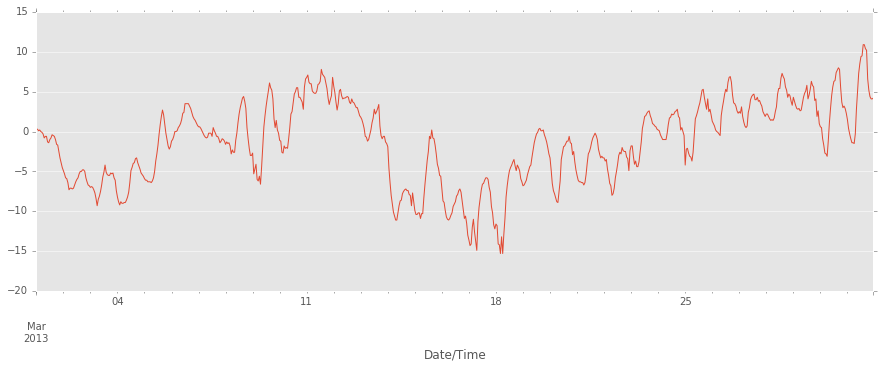
Separating it into three cells gives a slightly better view
url = url_template.format(month=3, year=2013)
ott_weather_mar2013 = pd.read_csv(url, skiprows=15, index_col='Date/Time', parse_dates=True, encoding='latin1')
ott_weather_mar2013[u"Temp (\xc2\xb0C)"].plot(figsize=(15, 5))
<matplotlib.axes._subplots.AxesSubplot at 0x1108fead0>
url = url_template.format(month=3, year=2014)
ott_weather_mar2014 = pd.read_csv(url, skiprows=15, index_col='Date/Time', parse_dates=True, encoding='latin1')
ott_weather_mar2014[u"Temp (\xc2\xb0C)"].plot(figsize=(15, 5))
<matplotlib.axes._subplots.AxesSubplot at 0x110913790>
url = url_template.format(month=3, year=2015)
ott_weather_mar2015 = pd.read_csv(url, skiprows=15, index_col='Date/Time', parse_dates=True, encoding='latin1')
ott_weather_mar2015[u"Temp (\xc2\xb0C)"].plot(figsize=(15, 5))
<matplotlib.axes._subplots.AxesSubplot at 0x111fcfe90>
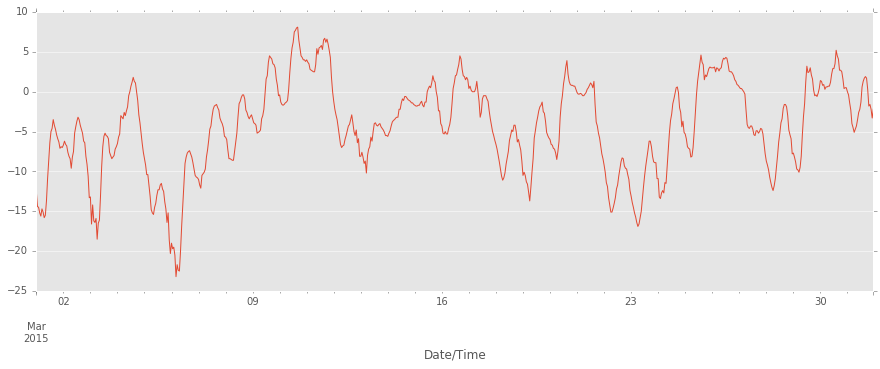
You can see that 2013, 2014 and 2015 were colder then 2012 in March.
Now I want to get rid of the screwy special characters in the temperature columns. They look odd in the headers and require entering them as hex values. We can see the interpretation of them by listing the column values.
column_names = list(ott_weather_mar2012.columns.values)
column_names
[u'Year',
 u'Month',
 u'Day',
 u'Time',
 u'Data Quality',
 u'Temp (\xc2\xb0C)',
 u'Temp Flag',
 u'Dew Point Temp (\xc2\xb0C)',
 u'Dew Point Temp Flag',
 u'Rel Hum (%)',
 u'Rel Hum Flag',
 u'Wind Dir (10s deg)',
 u'Wind Dir Flag',
 u'Wind Spd (km/h)',
 u'Wind Spd Flag',
 u'Visibility (km)',
 u'Visibility Flag',
 u'Stn Press (kPa)',
 u'Stn Press Flag',
 u'Hmdx',
 u'Hmdx Flag',
 u'Wind Chill',
 u'Wind Chill Flag',
 u'Weather']
As you can see, we have some embedded characters there that could make life interesting. We can rename the column names using the rename function. We can look at the table again to see the difference. I’m going to strip out the  and ° characters, as they are bot east to type on my keyboard and do not really add anything.
ott_weather_mar2012.rename(columns = {u"Temp (\xc2\xb0C)":u'Temp (C)',
                                      u"Dew Point Temp (\xc2\xb0C)":u'Dew Point Temp (C)'},
                           inplace = True)
ott_weather_mar2012
| Year | Month | Day | Time | Data Quality | Temp (C) | Temp Flag | Dew Point Temp (C) | Dew Point Temp Flag | Rel Hum (%) | ... | Wind Spd Flag | Visibility (km) | Visibility Flag | Stn Press (kPa) | Stn Press Flag | Hmdx | Hmdx Flag | Wind Chill | Wind Chill Flag | Weather | |
|---|---|---|---|---|---|---|---|---|---|---|---|---|---|---|---|---|---|---|---|---|---|
| Date/Time | |||||||||||||||||||||
| 2012-03-01 00:00:00 | 2012 | 3 | 1 | 00:00 | Â | -6.2 | NaN | -8.0 | NaN | 87 | ... | NaN | 2.4 | NaN | 99.59 | NaN | NaN | NaN | -15 | NaN | Snow,Blowing Snow |
| 2012-03-01 01:00:00 | 2012 | 3 | 1 | 01:00 | Â | -6.1 | NaN | -7.6 | NaN | 89 | ... | NaN | 1.6 | NaN | 99.51 | NaN | NaN | NaN | -15 | NaN | Snow,Blowing Snow |
| 2012-03-01 02:00:00 | 2012 | 3 | 1 | 02:00 | Â | -6.2 | NaN | -7.7 | NaN | 89 | ... | NaN | 1.6 | NaN | 99.36 | NaN | NaN | NaN | -15 | NaN | Snow,Blowing Snow |
| 2012-03-01 03:00:00 | 2012 | 3 | 1 | 03:00 | Â | -6.2 | NaN | -7.9 | NaN | 88 | ... | NaN | 3.2 | NaN | 99.31 | NaN | NaN | NaN | -15 | NaN | Snow,Blowing Snow |
| 2012-03-01 04:00:00 | 2012 | 3 | 1 | 04:00 | Â | -6.3 | NaN | -7.8 | NaN | 89 | ... | NaN | 8.1 | NaN | 99.27 | NaN | NaN | NaN | -14 | NaN | Snow,Blowing Snow |
| 2012-03-01 05:00:00 | 2012 | 3 | 1 | 05:00 | Â | -6.0 | NaN | -7.2 | NaN | 91 | ... | NaN | 6.4 | NaN | 99.26 | NaN | NaN | NaN | -14 | NaN | Freezing Drizzle,Ice Pellets |
| 2012-03-01 06:00:00 | 2012 | 3 | 1 | 06:00 | Â | -5.6 | NaN | -7.0 | NaN | 90 | ... | NaN | 9.7 | NaN | 99.19 | NaN | NaN | NaN | -14 | NaN | Freezing Drizzle |
| 2012-03-01 07:00:00 | 2012 | 3 | 1 | 07:00 | Â | -5.8 | NaN | -7.6 | NaN | 87 | ... | NaN | 10.0 | NaN | 99.20 | NaN | NaN | NaN | -15 | NaN | Blowing Snow |
| 2012-03-01 08:00:00 | 2012 | 3 | 1 | 08:00 | Â | -5.8 | NaN | -7.5 | NaN | 88 | ... | NaN | 10.0 | NaN | 99.22 | NaN | NaN | NaN | -15 | NaN | Blowing Snow |
| 2012-03-01 09:00:00 | 2012 | 3 | 1 | 09:00 | Â | -5.7 | NaN | -7.2 | NaN | 89 | ... | NaN | 2.8 | NaN | 99.25 | NaN | NaN | NaN | -14 | NaN | Snow,Fog,Blowing Snow |
| 2012-03-01 10:00:00 | 2012 | 3 | 1 | 10:00 | Â | -5.7 | NaN | -7.4 | NaN | 88 | ... | NaN | 1.6 | NaN | 99.28 | NaN | NaN | NaN | -14 | NaN | Snow,Fog,Blowing Snow |
| 2012-03-01 11:00:00 | 2012 | 3 | 1 | 11:00 | Â | -5.5 | NaN | -7.3 | NaN | 87 | ... | NaN | 1.6 | NaN | 99.32 | NaN | NaN | NaN | -14 | NaN | Snow,Fog,Blowing Snow |
| 2012-03-01 12:00:00 | 2012 | 3 | 1 | 12:00 | Â | -4.9 | NaN | -6.9 | NaN | 86 | ... | NaN | 4.8 | NaN | 99.34 | NaN | NaN | NaN | -13 | NaN | Snow,Fog,Blowing Snow |
| 2012-03-01 13:00:00 | 2012 | 3 | 1 | 13:00 | Â | -4.4 | NaN | -6.3 | NaN | 87 | ... | NaN | 1.6 | NaN | 99.34 | NaN | NaN | NaN | -12 | NaN | Snow,Fog,Blowing Snow |
| 2012-03-01 14:00:00 | 2012 | 3 | 1 | 14:00 | Â | -3.9 | NaN | -6.1 | NaN | 85 | ... | NaN | 4.8 | NaN | 99.36 | NaN | NaN | NaN | -12 | NaN | Snow,Fog,Blowing Snow |
| 2012-03-01 15:00:00 | 2012 | 3 | 1 | 15:00 | Â | -4.3 | NaN | -6.6 | NaN | 84 | ... | NaN | 10.0 | NaN | 99.42 | NaN | NaN | NaN | -13 | NaN | Snow,Blowing Snow |
| 2012-03-01 16:00:00 | 2012 | 3 | 1 | 16:00 | Â | -4.7 | NaN | -7.0 | NaN | 84 | ... | NaN | 10.0 | NaN | 99.47 | NaN | NaN | NaN | -13 | NaN | Snow,Blowing Snow |
| 2012-03-01 17:00:00 | 2012 | 3 | 1 | 17:00 | Â | -4.7 | NaN | -6.9 | NaN | 85 | ... | NaN | 10.0 | NaN | 99.54 | NaN | NaN | NaN | -13 | NaN | Blowing Snow |
| 2012-03-01 18:00:00 | 2012 | 3 | 1 | 18:00 | Â | -5.2 | NaN | -7.0 | NaN | 87 | ... | NaN | 10.0 | NaN | 99.66 | NaN | NaN | NaN | -13 | NaN | Snow,Blowing Snow |
| 2012-03-01 19:00:00 | 2012 | 3 | 1 | 19:00 | Â | -5.4 | NaN | -7.2 | NaN | 87 | ... | NaN | 10.0 | NaN | 99.71 | NaN | NaN | NaN | -12 | NaN | Snow,Blowing Snow |
| 2012-03-01 20:00:00 | 2012 | 3 | 1 | 20:00 | Â | -5.4 | NaN | -7.1 | NaN | 88 | ... | NaN | 6.4 | NaN | 99.72 | NaN | NaN | NaN | -13 | NaN | Snow,Blowing Snow |
| 2012-03-01 21:00:00 | 2012 | 3 | 1 | 21:00 | Â | -5.4 | NaN | -7.1 | NaN | 88 | ... | NaN | 10.0 | NaN | 99.82 | NaN | NaN | NaN | -12 | NaN | Snow,Blowing Snow |
| 2012-03-01 22:00:00 | 2012 | 3 | 1 | 22:00 | Â | -5.5 | NaN | -7.2 | NaN | 88 | ... | NaN | 4.8 | NaN | 99.88 | NaN | NaN | NaN | -13 | NaN | Snow,Blowing Snow |
| 2012-03-01 23:00:00 | 2012 | 3 | 1 | 23:00 | Â | -5.5 | NaN | -7.2 | NaN | 88 | ... | NaN | 4.8 | NaN | 99.89 | NaN | NaN | NaN | -12 | NaN | Freezing Drizzle,Snow |
| 2012-03-02 00:00:00 | 2012 | 3 | 2 | 00:00 | Â | -5.6 | NaN | -7.1 | NaN | 89 | ... | NaN | 9.7 | NaN | 99.93 | NaN | NaN | NaN | -11 | NaN | Snow |
| 2012-03-02 01:00:00 | 2012 | 3 | 2 | 01:00 | Â | -5.7 | NaN | -7.2 | NaN | 89 | ... | NaN | 10.0 | NaN | 100.01 | NaN | NaN | NaN | -10 | NaN | Snow |
| 2012-03-02 02:00:00 | 2012 | 3 | 2 | 02:00 | Â | -5.8 | NaN | -7.3 | NaN | 89 | ... | NaN | 6.4 | NaN | 100.08 | NaN | NaN | NaN | -9 | NaN | Freezing Drizzle,Snow Grains |
| 2012-03-02 03:00:00 | 2012 | 3 | 2 | 03:00 | Â | -5.9 | NaN | -7.3 | NaN | 90 | ... | NaN | 10.0 | NaN | 100.06 | NaN | NaN | NaN | -10 | NaN | Freezing Drizzle,Snow Grains |
| 2012-03-02 04:00:00 | 2012 | 3 | 2 | 04:00 | Â | -6.1 | NaN | -7.6 | NaN | 89 | ... | NaN | 10.0 | NaN | 100.09 | NaN | NaN | NaN | -11 | NaN | Snow |
| 2012-03-02 05:00:00 | 2012 | 3 | 2 | 05:00 | Â | -6.3 | NaN | -7.8 | NaN | 89 | ... | NaN | 10.0 | NaN | 100.08 | NaN | NaN | NaN | -11 | NaN | NaN |
| ... | ... | ... | ... | ... | ... | ... | ... | ... | ... | ... | ... | ... | ... | ... | ... | ... | ... | ... | ... | ... | ... |
| 2012-03-30 18:00:00 | 2012 | 3 | 30 | 18:00 | Â | 2.5 | NaN | -11.1 | NaN | 36 | ... | NaN | 10.0 | NaN | 100.32 | NaN | NaN | NaN | NaN | NaN | NaN |
| 2012-03-30 19:00:00 | 2012 | 3 | 30 | 19:00 | Â | 2.0 | NaN | -10.9 | NaN | 38 | ... | NaN | 10.0 | NaN | 100.33 | NaN | NaN | NaN | NaN | NaN | Mostly Cloudy |
| 2012-03-30 20:00:00 | 2012 | 3 | 30 | 20:00 | Â | 1.4 | NaN | -10.2 | NaN | 42 | ... | NaN | 10.0 | NaN | 100.36 | NaN | NaN | NaN | NaN | NaN | NaN |
| 2012-03-30 21:00:00 | 2012 | 3 | 30 | 21:00 | Â | 0.9 | NaN | -10.0 | NaN | 44 | ... | NaN | 10.0 | NaN | 100.36 | NaN | NaN | NaN | NaN | NaN | NaN |
| 2012-03-30 22:00:00 | 2012 | 3 | 30 | 22:00 | Â | 0.7 | NaN | -10.2 | NaN | 44 | ... | NaN | 10.0 | NaN | 100.37 | NaN | NaN | NaN | NaN | NaN | Mainly Clear |
| 2012-03-30 23:00:00 | 2012 | 3 | 30 | 23:00 | Â | 0.1 | NaN | -9.7 | NaN | 48 | ... | NaN | 10.0 | NaN | 100.34 | NaN | NaN | NaN | NaN | NaN | NaN |
| 2012-03-31 00:00:00 | 2012 | 3 | 31 | 00:00 | Â | -0.4 | NaN | -9.4 | NaN | 51 | ... | NaN | 10.0 | NaN | 100.29 | NaN | NaN | NaN | -5 | NaN | NaN |
| 2012-03-31 01:00:00 | 2012 | 3 | 31 | 01:00 | Â | -0.4 | NaN | -9.1 | NaN | 52 | ... | NaN | 10.0 | NaN | 100.30 | NaN | NaN | NaN | -5 | NaN | Mostly Cloudy |
| 2012-03-31 02:00:00 | 2012 | 3 | 31 | 02:00 | Â | -0.4 | NaN | -8.6 | NaN | 54 | ... | NaN | 10.0 | NaN | 100.26 | NaN | NaN | NaN | -5 | NaN | NaN |
| 2012-03-31 03:00:00 | 2012 | 3 | 31 | 03:00 | Â | -0.4 | NaN | -8.4 | NaN | 55 | ... | NaN | 10.0 | NaN | 100.29 | NaN | NaN | NaN | -5 | NaN | NaN |
| 2012-03-31 04:00:00 | 2012 | 3 | 31 | 04:00 | Â | -0.6 | NaN | -8.3 | NaN | 56 | ... | NaN | 10.0 | NaN | 100.25 | NaN | NaN | NaN | -6 | NaN | Mostly Cloudy |
| 2012-03-31 05:00:00 | 2012 | 3 | 31 | 05:00 | Â | -0.8 | NaN | -8.5 | NaN | 56 | ... | NaN | 10.0 | NaN | 100.23 | NaN | NaN | NaN | -6 | NaN | NaN |
| 2012-03-31 06:00:00 | 2012 | 3 | 31 | 06:00 | Â | -0.9 | NaN | -8.9 | NaN | 55 | ... | NaN | 10.0 | NaN | 100.26 | NaN | NaN | NaN | -6 | NaN | NaN |
| 2012-03-31 07:00:00 | 2012 | 3 | 31 | 07:00 | Â | -0.2 | NaN | -8.9 | NaN | 52 | ... | NaN | 10.0 | NaN | 100.31 | NaN | NaN | NaN | -5 | NaN | Mostly Cloudy |
| 2012-03-31 08:00:00 | 2012 | 3 | 31 | 08:00 | Â | 1.9 | NaN | -8.8 | NaN | 45 | ... | NaN | 10.0 | NaN | 100.32 | NaN | NaN | NaN | NaN | NaN | NaN |
| 2012-03-31 09:00:00 | 2012 | 3 | 31 | 09:00 | Â | 3.3 | NaN | -9.1 | NaN | 40 | ... | NaN | 10.0 | NaN | 100.30 | NaN | NaN | NaN | NaN | NaN | NaN |
| 2012-03-31 10:00:00 | 2012 | 3 | 31 | 10:00 | Â | 5.1 | NaN | -8.4 | NaN | 37 | ... | NaN | 10.0 | NaN | 100.27 | NaN | NaN | NaN | NaN | NaN | Mainly Clear |
| 2012-03-31 11:00:00 | 2012 | 3 | 31 | 11:00 | Â | 6.3 | NaN | -8.8 | NaN | 33 | ... | NaN | 10.0 | NaN | 100.23 | NaN | NaN | NaN | NaN | NaN | NaN |
| 2012-03-31 12:00:00 | 2012 | 3 | 31 | 12:00 | Â | 6.7 | NaN | -9.3 | NaN | 31 | ... | NaN | 10.0 | NaN | 100.18 | NaN | NaN | NaN | NaN | NaN | NaN |
| 2012-03-31 13:00:00 | 2012 | 3 | 31 | 13:00 | Â | 7.7 | NaN | -9.3 | NaN | 29 | ... | NaN | 10.0 | NaN | 100.10 | NaN | NaN | NaN | NaN | NaN | Clear |
| 2012-03-31 14:00:00 | 2012 | 3 | 31 | 14:00 | Â | 8.2 | NaN | -8.8 | NaN | 29 | ... | NaN | 10.0 | NaN | 100.00 | NaN | NaN | NaN | NaN | NaN | NaN |
| 2012-03-31 15:00:00 | 2012 | 3 | 31 | 15:00 | Â | 8.9 | NaN | -8.7 | NaN | 28 | ... | NaN | 10.0 | NaN | 99.95 | NaN | NaN | NaN | NaN | NaN | NaN |
| 2012-03-31 16:00:00 | 2012 | 3 | 31 | 16:00 | Â | 8.6 | NaN | -9.9 | NaN | 26 | ... | NaN | 10.0 | NaN | 99.91 | NaN | NaN | NaN | NaN | NaN | Mainly Clear |
| 2012-03-31 17:00:00 | 2012 | 3 | 31 | 17:00 | Â | 8.1 | NaN | -10.3 | NaN | 26 | ... | NaN | 10.0 | NaN | 99.89 | NaN | NaN | NaN | NaN | NaN | NaN |
| 2012-03-31 18:00:00 | 2012 | 3 | 31 | 18:00 | Â | 6.2 | NaN | -10.6 | NaN | 29 | ... | NaN | 10.0 | NaN | 99.92 | NaN | NaN | NaN | NaN | NaN | NaN |
| 2012-03-31 19:00:00 | 2012 | 3 | 31 | 19:00 | Â | 5.6 | NaN | -11.1 | NaN | 29 | ... | NaN | 10.0 | NaN | 99.91 | NaN | NaN | NaN | NaN | NaN | Clear |
| 2012-03-31 20:00:00 | 2012 | 3 | 31 | 20:00 | Â | 2.7 | NaN | -9.9 | NaN | 39 | ... | NaN | 10.0 | NaN | 99.91 | NaN | NaN | NaN | NaN | NaN | NaN |
| 2012-03-31 21:00:00 | 2012 | 3 | 31 | 21:00 | Â | 0.7 | NaN | -9.9 | NaN | 45 | ... | NaN | 10.0 | NaN | 99.91 | NaN | NaN | NaN | NaN | NaN | NaN |
| 2012-03-31 22:00:00 | 2012 | 3 | 31 | 22:00 | Â | 1.8 | NaN | -9.8 | NaN | 42 | ... | NaN | 10.0 | NaN | 99.84 | NaN | NaN | NaN | NaN | NaN | Clear |
| 2012-03-31 23:00:00 | 2012 | 3 | 31 | 23:00 | Â | 0.7 | NaN | -9.9 | NaN | 45 | ... | NaN | 10.0 | NaN | 99.82 | NaN | NaN | NaN | NaN | NaN | NaN |
744 rows × 24 columns
We have a success, the extra characters are gone.
You may have noticed that in the output table summary above, there are columns which are are either entirely empty or only have a few values in them. We could use a shortcut and use the dropna function.
Something like this: ott_weather_mar2012 = ott_weather_mar2012.dropna(axis=1, how='any')
The argument axis=1 to dropna means “drop columns”, not rows", and how='any' means “drop the column if any value is null”.
This technique works well if you can guarantee the columns you are interested in have data. In this case, you can see from the plot above that the temperature data has at least one discontinuity. We could do it the hard way, by using the column names and the drop function.
Just to show what would happen, I’ll make a copy of the table and use the dropna function.
datacopy = ott_weather_mar2012
datacopy = datacopy.dropna(axis=1, how='any')
datacopy[:5]
| Year | Month | Day | Time | Data Quality | |
|---|---|---|---|---|---|
| Date/Time | |||||
| 2012-03-01 00:00:00 | 2012 | 3 | 1 | 00:00 | Â |
| 2012-03-01 01:00:00 | 2012 | 3 | 1 | 01:00 | Â |
| 2012-03-01 02:00:00 | 2012 | 3 | 1 | 02:00 | Â |
| 2012-03-01 03:00:00 | 2012 | 3 | 1 | 03:00 | Â |
| 2012-03-01 04:00:00 | 2012 | 3 | 1 | 04:00 | Â |
In most of my tests, this deleted the Temp (C) column. In order to avoid that, we would have had to drop by name or manipulated the data to remove missing rows from the data set. The generated list of column labels could have been useful if we wanted to programmatically remove columns we are not interested in.
The Year/Month/Day/Time columns are not necessary - it is duplicate data. The Data Quality column doesn’t look like it has anything of value either, so out they go.
This time, we use the drop function. We will still use the axis=1 argument so we drop columns. The default for operations like dropna and drop is always to operate on rows.
ott_weather_mar2012 = ott_weather_mar2012.drop(['Year', 'Month', 'Day', 'Time',
    'Data Quality'], axis=1)
ott_weather_mar2012[:5]
| Temp (C) | Temp Flag | Dew Point Temp (C) | Dew Point Temp Flag | Rel Hum (%) | Rel Hum Flag | Wind Dir (10s deg) | Wind Dir Flag | Wind Spd (km/h) | Wind Spd Flag | Visibility (km) | Visibility Flag | Stn Press (kPa) | Stn Press Flag | Hmdx | Hmdx Flag | Wind Chill | Wind Chill Flag | Weather | |
|---|---|---|---|---|---|---|---|---|---|---|---|---|---|---|---|---|---|---|---|
| Date/Time | |||||||||||||||||||
| 2012-03-01 00:00:00 | -6.2 | NaN | -8.0 | NaN | 87 | NaN | 7 | NaN | 31 | NaN | 2.4 | NaN | 99.59 | NaN | NaN | NaN | -15 | NaN | Snow,Blowing Snow |
| 2012-03-01 01:00:00 | -6.1 | NaN | -7.6 | NaN | 89 | NaN | 6 | NaN | 31 | NaN | 1.6 | NaN | 99.51 | NaN | NaN | NaN | -15 | NaN | Snow,Blowing Snow |
| 2012-03-01 02:00:00 | -6.2 | NaN | -7.7 | NaN | 89 | NaN | 6 | NaN | 34 | NaN | 1.6 | NaN | 99.36 | NaN | NaN | NaN | -15 | NaN | Snow,Blowing Snow |
| 2012-03-01 03:00:00 | -6.2 | NaN | -7.9 | NaN | 88 | NaN | 6 | NaN | 36 | NaN | 3.2 | NaN | 99.31 | NaN | NaN | NaN | -15 | NaN | Snow,Blowing Snow |
| 2012-03-01 04:00:00 | -6.3 | NaN | -7.8 | NaN | 89 | NaN | 6 | NaN | 27 | NaN | 8.1 | NaN | 99.27 | NaN | NaN | NaN | -14 | NaN | Snow,Blowing Snow |
We can still remove a few columns we don’t need. The dropna will kill our data, so we can manually drop a number of the columns and we will certainly have a much more manageable table to work with. I am not bothering at this time. You would still have to specify them somehow and you can’t do it programatically unless you already know which columns you wish to key.
The object here is to start with a known data set and reduce it to what we want to work with. All steps are visible and the original data has not been touched. All modifications are documented and anybody can reproduce your steps with the same set of tools. Interpretations of the results later may differ, but the path is visible and can be followed.
This is the reproducible part of reproducible research that is mentioned in all of the data science courses/books/talks/etc. The data and the methodology is available for anyone to see and use.
How about plotting the temperature by hour of day?
Using the groupby and aggregate functions, you can determine if it gets colder at night. While you already know the answer from experience, we can show it visually. We group readings by the hour, get the average of each group and then plot the results.
temperatures = ott_weather_mar2012[[u'Temp (C)']].copy()
print(temperatures.head)
temperatures.loc[:,'Hour'] = ott_weather_mar2012.index.hour
temperatures.groupby('Hour').aggregate(np.median).plot()
<bound method DataFrame.head of                      Temp (C)
Date/Time
2012-03-01 00:00:00      -6.2
2012-03-01 01:00:00      -6.1
2012-03-01 02:00:00      -6.2
2012-03-01 03:00:00      -6.2
2012-03-01 04:00:00      -6.3
2012-03-01 05:00:00      -6.0
2012-03-01 06:00:00      -5.6
2012-03-01 07:00:00      -5.8
2012-03-01 08:00:00      -5.8
2012-03-01 09:00:00      -5.7
2012-03-01 10:00:00      -5.7
2012-03-01 11:00:00      -5.5
2012-03-01 12:00:00      -4.9
2012-03-01 13:00:00      -4.4
2012-03-01 14:00:00      -3.9
2012-03-01 15:00:00      -4.3
2012-03-01 16:00:00      -4.7
2012-03-01 17:00:00      -4.7
2012-03-01 18:00:00      -5.2
2012-03-01 19:00:00      -5.4
2012-03-01 20:00:00      -5.4
2012-03-01 21:00:00      -5.4
2012-03-01 22:00:00      -5.5
2012-03-01 23:00:00      -5.5
2012-03-02 00:00:00      -5.6
2012-03-02 01:00:00      -5.7
2012-03-02 02:00:00      -5.8
2012-03-02 03:00:00      -5.9
2012-03-02 04:00:00      -6.1
2012-03-02 05:00:00      -6.3
...                       ...
2012-03-30 18:00:00       2.5
2012-03-30 19:00:00       2.0
2012-03-30 20:00:00       1.4
2012-03-30 21:00:00       0.9
2012-03-30 22:00:00       0.7
2012-03-30 23:00:00       0.1
2012-03-31 00:00:00      -0.4
2012-03-31 01:00:00      -0.4
2012-03-31 02:00:00      -0.4
2012-03-31 03:00:00      -0.4
2012-03-31 04:00:00      -0.6
2012-03-31 05:00:00      -0.8
2012-03-31 06:00:00      -0.9
2012-03-31 07:00:00      -0.2
2012-03-31 08:00:00       1.9
2012-03-31 09:00:00       3.3
2012-03-31 10:00:00       5.1
2012-03-31 11:00:00       6.3
2012-03-31 12:00:00       6.7
2012-03-31 13:00:00       7.7
2012-03-31 14:00:00       8.2
2012-03-31 15:00:00       8.9
2012-03-31 16:00:00       8.6
2012-03-31 17:00:00       8.1
2012-03-31 18:00:00       6.2
2012-03-31 19:00:00       5.6
2012-03-31 20:00:00       2.7
2012-03-31 21:00:00       0.7
2012-03-31 22:00:00       1.8
2012-03-31 23:00:00       0.7

[744 rows x 1 columns]>


<matplotlib.axes._subplots.AxesSubplot at 0x10c438b10>
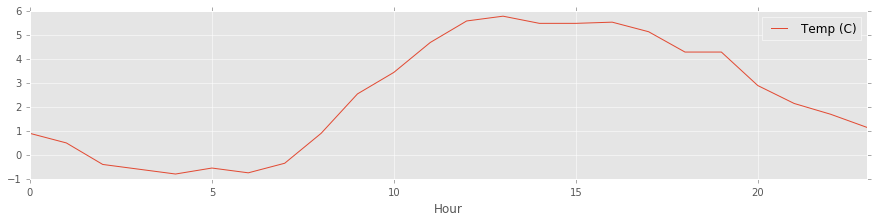
In our case, Ottawa appears to have the highest median temperature at 13:00 in March. Another question that I will not bother with at present would be to see what the highest median temperature for each month and see if it varies during the year. You could also do this across multiple years and see if there is a trend or if it has a lot of variation.
Obtaining a whole year of data
If we want the data for the whole year, we would just ask for it. Unfortunately, it seems to be only available by month so you need to gather each month and combine them.
First step, use the work from above to create a function that downloads the weather for a given month.
The author of the original notebook noticed that there’s an irritating bug where when you ask for January, it gives the data for the previous year. The data set seems to have had that corrected, so we don’t require a special case for January. This function is a modified version of the original, which no longer needs to correct January nor does it munge the data. We will do that later.
def download_weather_month(year, month):

    url = url_template.format(year=year, month=month)
    weather_data = pd.read_csv(url, skiprows=15, index_col='Date/Time', parse_dates=True, encoding='latin1')
    return weather_data
We can test that this function does the right thing:
download_weather_month(2012, 1)[:5]
| Year | Month | Day | Time | Data Quality | Temp (°C) | Temp Flag | Dew Point Temp (°C) | Dew Point Temp Flag | Rel Hum (%) | ... | Wind Spd Flag | Visibility (km) | Visibility Flag | Stn Press (kPa) | Stn Press Flag | Hmdx | Hmdx Flag | Wind Chill | Wind Chill Flag | Weather | |
|---|---|---|---|---|---|---|---|---|---|---|---|---|---|---|---|---|---|---|---|---|---|
| Date/Time | |||||||||||||||||||||
| 2012-01-01 00:00:00 | 2012 | 1 | 1 | 00:00 | Â | -3.8 | NaN | -5.1 | NaN | 91 | ... | NaN | 10.0 | NaN | 100.31 | NaN | NaN | NaN | -8 | NaN | NaN |
| 2012-01-01 01:00:00 | 2012 | 1 | 1 | 01:00 | Â | -3.9 | NaN | -5.2 | NaN | 91 | ... | NaN | 10.0 | NaN | 100.29 | NaN | NaN | NaN | -8 | NaN | Cloudy |
| 2012-01-01 02:00:00 | 2012 | 1 | 1 | 02:00 | Â | -3.9 | NaN | -5.0 | NaN | 92 | ... | NaN | 10.0 | NaN | 100.25 | NaN | NaN | NaN | -7 | NaN | NaN |
| 2012-01-01 03:00:00 | 2012 | 1 | 1 | 03:00 | Â | -3.9 | NaN | -4.7 | NaN | 94 | ... | NaN | 6.4 | NaN | 100.27 | NaN | NaN | NaN | -8 | NaN | Fog |
| 2012-01-01 04:00:00 | 2012 | 1 | 1 | 04:00 | Â | -3.9 | NaN | -4.7 | NaN | 94 | ... | NaN | 4.8 | NaN | 100.35 | NaN | NaN | NaN | -8 | NaN | Fog |
5 rows × 24 columns
With this function, we can get all the months at once. This will take a little while to run.
ott_data_by_month = [download_weather_month(2012, i) for i in range(1, 13)]
Once we have run this, it’s easy to concatenate all the dataframes together into one big dataframe using pd.concat. The result is the whole year’s data.
ott_weather_2012 = pd.concat(ott_data_by_month)
ott_weather_2012
| Year | Month | Day | Time | Data Quality | Temp (°C) | Temp Flag | Dew Point Temp (°C) | Dew Point Temp Flag | Rel Hum (%) | ... | Wind Spd Flag | Visibility (km) | Visibility Flag | Stn Press (kPa) | Stn Press Flag | Hmdx | Hmdx Flag | Wind Chill | Wind Chill Flag | Weather | |
|---|---|---|---|---|---|---|---|---|---|---|---|---|---|---|---|---|---|---|---|---|---|
| Date/Time | |||||||||||||||||||||
| 2012-01-01 00:00:00 | 2012 | 1 | 1 | 00:00 | Â | -3.8 | NaN | -5.1 | NaN | 91 | ... | NaN | 10.0 | NaN | 100.31 | NaN | NaN | NaN | -8 | NaN | NaN |
| 2012-01-01 01:00:00 | 2012 | 1 | 1 | 01:00 | Â | -3.9 | NaN | -5.2 | NaN | 91 | ... | NaN | 10.0 | NaN | 100.29 | NaN | NaN | NaN | -8 | NaN | Cloudy |
| 2012-01-01 02:00:00 | 2012 | 1 | 1 | 02:00 | Â | -3.9 | NaN | -5.0 | NaN | 92 | ... | NaN | 10.0 | NaN | 100.25 | NaN | NaN | NaN | -7 | NaN | NaN |
| 2012-01-01 03:00:00 | 2012 | 1 | 1 | 03:00 | Â | -3.9 | NaN | -4.7 | NaN | 94 | ... | NaN | 6.4 | NaN | 100.27 | NaN | NaN | NaN | -8 | NaN | Fog |
| 2012-01-01 04:00:00 | 2012 | 1 | 1 | 04:00 | Â | -3.9 | NaN | -4.7 | NaN | 94 | ... | NaN | 4.8 | NaN | 100.35 | NaN | NaN | NaN | -8 | NaN | Fog |
| 2012-01-01 05:00:00 | 2012 | 1 | 1 | 05:00 | Â | -3.8 | NaN | -4.8 | NaN | 93 | ... | NaN | 8.1 | NaN | 100.28 | NaN | NaN | NaN | -5 | NaN | Fog |
| 2012-01-01 06:00:00 | 2012 | 1 | 1 | 06:00 | Â | -3.7 | NaN | -4.7 | NaN | 93 | ... | NaN | 9.7 | NaN | 100.23 | NaN | NaN | NaN | -6 | NaN | Fog |
| 2012-01-01 07:00:00 | 2012 | 1 | 1 | 07:00 | Â | -3.6 | NaN | -4.6 | NaN | 93 | ... | NaN | 9.7 | NaN | 100.16 | NaN | NaN | NaN | -7 | NaN | Fog |
| 2012-01-01 08:00:00 | 2012 | 1 | 1 | 08:00 | Â | -3.4 | NaN | -4.4 | NaN | 93 | ... | NaN | 4.8 | NaN | 100.10 | NaN | NaN | NaN | -7 | NaN | Fog |
| 2012-01-01 09:00:00 | 2012 | 1 | 1 | 09:00 | Â | -2.9 | NaN | -3.7 | NaN | 94 | ... | NaN | 4.8 | NaN | 100.06 | NaN | NaN | NaN | -7 | NaN | Fog |
| 2012-01-01 10:00:00 | 2012 | 1 | 1 | 10:00 | Â | -2.3 | NaN | -3.1 | NaN | 94 | ... | NaN | 4.8 | NaN | 99.96 | NaN | NaN | NaN | -6 | NaN | Fog |
| 2012-01-01 11:00:00 | 2012 | 1 | 1 | 11:00 | Â | -1.7 | NaN | -2.4 | NaN | 95 | ... | NaN | 3.2 | NaN | 99.76 | NaN | NaN | NaN | -6 | NaN | Fog |
| 2012-01-01 12:00:00 | 2012 | 1 | 1 | 12:00 | Â | -0.7 | NaN | -1.4 | NaN | 95 | ... | NaN | 1.6 | NaN | 99.49 | NaN | NaN | NaN | -5 | NaN | Fog |
| 2012-01-01 13:00:00 | 2012 | 1 | 1 | 13:00 | Â | 0.1 | NaN | -0.6 | NaN | 95 | ... | NaN | 2.4 | NaN | 99.22 | NaN | NaN | NaN | NaN | NaN | Fog |
| 2012-01-01 14:00:00 | 2012 | 1 | 1 | 14:00 | Â | 0.7 | NaN | -0.5 | NaN | 92 | ... | NaN | 4.8 | NaN | 98.97 | NaN | NaN | NaN | NaN | NaN | Fog |
| 2012-01-01 15:00:00 | 2012 | 1 | 1 | 15:00 | Â | 0.7 | NaN | -0.5 | NaN | 92 | ... | NaN | 6.4 | NaN | 98.86 | NaN | NaN | NaN | NaN | NaN | Fog |
| 2012-01-01 16:00:00 | 2012 | 1 | 1 | 16:00 | Â | 0.3 | NaN | -0.6 | NaN | 94 | ... | NaN | 4.8 | NaN | 98.81 | NaN | NaN | NaN | NaN | NaN | Rain,Fog |
| 2012-01-01 17:00:00 | 2012 | 1 | 1 | 17:00 | Â | 0.1 | NaN | -0.5 | NaN | 96 | ... | NaN | 4.8 | NaN | 98.67 | NaN | NaN | NaN | NaN | NaN | Rain,Fog |
| 2012-01-01 18:00:00 | 2012 | 1 | 1 | 18:00 | Â | 0.2 | NaN | -0.2 | NaN | 97 | ... | NaN | 4.8 | NaN | 98.49 | NaN | NaN | NaN | NaN | NaN | Rain,Fog |
| 2012-01-01 19:00:00 | 2012 | 1 | 1 | 19:00 | Â | 1.4 | NaN | 0.8 | NaN | 96 | ... | NaN | 8.1 | NaN | 98.39 | NaN | NaN | NaN | NaN | NaN | Rain,Fog |
| 2012-01-01 20:00:00 | 2012 | 1 | 1 | 20:00 | Â | 1.8 | NaN | 1.2 | NaN | 96 | ... | NaN | 8.1 | NaN | 98.32 | NaN | NaN | NaN | NaN | NaN | Rain,Fog |
| 2012-01-01 21:00:00 | 2012 | 1 | 1 | 21:00 | Â | 4.7 | NaN | 3.8 | NaN | 94 | ... | NaN | 10.0 | NaN | 98.23 | NaN | NaN | NaN | NaN | NaN | NaN |
| 2012-01-01 22:00:00 | 2012 | 1 | 1 | 22:00 | Â | 4.6 | NaN | 2.6 | NaN | 87 | ... | NaN | 10.0 | NaN | 98.21 | NaN | NaN | NaN | NaN | NaN | NaN |
| 2012-01-01 23:00:00 | 2012 | 1 | 1 | 23:00 | Â | 4.0 | NaN | 2.0 | NaN | 87 | ... | NaN | 10.0 | NaN | 98.17 | NaN | NaN | NaN | NaN | NaN | NaN |
| 2012-01-02 00:00:00 | 2012 | 1 | 2 | 00:00 | Â | 3.7 | NaN | 1.1 | NaN | 83 | ... | NaN | 10.0 | NaN | 98.17 | NaN | NaN | NaN | NaN | NaN | NaN |
| 2012-01-02 01:00:00 | 2012 | 1 | 2 | 01:00 | Â | 2.9 | NaN | -0.2 | NaN | 80 | ... | NaN | 10.0 | NaN | 98.20 | NaN | NaN | NaN | NaN | NaN | Mainly Clear |
| 2012-01-02 02:00:00 | 2012 | 1 | 2 | 02:00 | Â | 2.3 | NaN | -1.1 | NaN | 78 | ... | NaN | 10.0 | NaN | 98.22 | NaN | NaN | NaN | NaN | NaN | NaN |
| 2012-01-02 03:00:00 | 2012 | 1 | 2 | 03:00 | Â | 1.8 | NaN | -2.5 | NaN | 73 | ... | NaN | 10.0 | NaN | 98.22 | NaN | NaN | NaN | NaN | NaN | NaN |
| 2012-01-02 04:00:00 | 2012 | 1 | 2 | 04:00 | Â | 1.7 | NaN | -2.4 | NaN | 74 | ... | NaN | 10.0 | NaN | 98.19 | NaN | NaN | NaN | NaN | NaN | NaN |
| 2012-01-02 05:00:00 | 2012 | 1 | 2 | 05:00 | Â | 1.4 | NaN | -2.7 | NaN | 74 | ... | NaN | 10.0 | NaN | 98.15 | NaN | NaN | NaN | NaN | NaN | NaN |
| ... | ... | ... | ... | ... | ... | ... | ... | ... | ... | ... | ... | ... | ... | ... | ... | ... | ... | ... | ... | ... | ... |
| 2012-12-30 18:00:00 | 2012 | 12 | 30 | 18:00 | Â | -13.1 | NaN | -16.5 | NaN | 76 | ... | NaN | 24.1 | NaN | 100.67 | NaN | NaN | NaN | -22 | NaN | NaN |
| 2012-12-30 19:00:00 | 2012 | 12 | 30 | 19:00 | Â | -12.4 | NaN | -15.5 | NaN | 78 | ... | NaN | 24.1 | NaN | 100.69 | NaN | NaN | NaN | -21 | NaN | Mainly Clear |
| 2012-12-30 20:00:00 | 2012 | 12 | 30 | 20:00 | Â | -12.3 | NaN | -15.2 | NaN | 79 | ... | NaN | 24.1 | NaN | 100.68 | NaN | NaN | NaN | -20 | NaN | NaN |
| 2012-12-30 21:00:00 | 2012 | 12 | 30 | 21:00 | Â | -11.3 | NaN | -14.3 | NaN | 79 | ... | NaN | 24.1 | NaN | 100.67 | NaN | NaN | NaN | -18 | NaN | NaN |
| 2012-12-30 22:00:00 | 2012 | 12 | 30 | 22:00 | Â | -10.8 | NaN | -13.8 | NaN | 79 | ... | NaN | 24.1 | NaN | 100.64 | NaN | NaN | NaN | -17 | NaN | Snow |
| 2012-12-30 23:00:00 | 2012 | 12 | 30 | 23:00 | Â | -10.9 | NaN | -13.6 | NaN | 81 | ... | NaN | 24.1 | NaN | 100.64 | NaN | NaN | NaN | -15 | NaN | Snow |
| 2012-12-31 00:00:00 | 2012 | 12 | 31 | 00:00 | Â | -10.5 | NaN | -12.6 | NaN | 85 | ... | NaN | 4.8 | NaN | 100.56 | NaN | NaN | NaN | -15 | NaN | Snow |
| 2012-12-31 01:00:00 | 2012 | 12 | 31 | 01:00 | Â | -11.1 | NaN | -12.7 | NaN | 88 | ... | NaN | 12.9 | NaN | 100.47 | NaN | NaN | NaN | -14 | NaN | Snow |
| 2012-12-31 02:00:00 | 2012 | 12 | 31 | 02:00 | Â | -10.7 | NaN | -12.5 | NaN | 87 | ... | NaN | 24.1 | NaN | 100.41 | NaN | NaN | NaN | -15 | NaN | Snow |
| 2012-12-31 03:00:00 | 2012 | 12 | 31 | 03:00 | Â | -10.3 | NaN | -12.1 | NaN | 87 | ... | NaN | 24.1 | NaN | 100.34 | NaN | NaN | NaN | -14 | NaN | Snow |
| 2012-12-31 04:00:00 | 2012 | 12 | 31 | 04:00 | Â | -10.0 | NaN | -11.6 | NaN | 88 | ... | NaN | 24.1 | NaN | 100.30 | NaN | NaN | NaN | NaN | NaN | Snow |
| 2012-12-31 05:00:00 | 2012 | 12 | 31 | 05:00 | Â | -9.7 | NaN | -11.3 | NaN | 88 | ... | NaN | 24.1 | NaN | 100.22 | NaN | NaN | NaN | -13 | NaN | Snow |
| 2012-12-31 06:00:00 | 2012 | 12 | 31 | 06:00 | Â | -8.7 | NaN | -10.3 | NaN | 88 | ... | NaN | 24.1 | NaN | 100.14 | NaN | NaN | NaN | -12 | NaN | NaN |
| 2012-12-31 07:00:00 | 2012 | 12 | 31 | 07:00 | Â | -8.5 | NaN | -10.1 | NaN | 88 | ... | NaN | 24.1 | NaN | 100.12 | NaN | NaN | NaN | NaN | NaN | Cloudy |
| 2012-12-31 08:00:00 | 2012 | 12 | 31 | 08:00 | Â | -8.6 | NaN | -10.1 | NaN | 89 | ... | NaN | 16.1 | NaN | 100.05 | NaN | NaN | NaN | -12 | NaN | Snow |
| 2012-12-31 09:00:00 | 2012 | 12 | 31 | 09:00 | Â | -8.3 | NaN | -10.1 | NaN | 87 | ... | NaN | 16.1 | NaN | 100.00 | NaN | NaN | NaN | -13 | NaN | Snow |
| 2012-12-31 10:00:00 | 2012 | 12 | 31 | 10:00 | Â | -6.9 | NaN | -8.7 | NaN | 87 | ... | NaN | 16.1 | NaN | 99.97 | NaN | NaN | NaN | -9 | NaN | Snow |
| 2012-12-31 11:00:00 | 2012 | 12 | 31 | 11:00 | Â | -3.5 | NaN | -5.2 | NaN | 88 | ... | NaN | 16.1 | NaN | 99.87 | NaN | NaN | NaN | -8 | NaN | Snow |
| 2012-12-31 12:00:00 | 2012 | 12 | 31 | 12:00 | Â | -2.5 | NaN | -4.7 | NaN | 85 | ... | NaN | 16.1 | NaN | 99.72 | NaN | NaN | NaN | -8 | NaN | Snow |
| 2012-12-31 13:00:00 | 2012 | 12 | 31 | 13:00 | Â | -2.1 | NaN | -5.1 | NaN | 80 | ... | NaN | 12.9 | NaN | 99.60 | NaN | NaN | NaN | -7 | NaN | Cloudy |
| 2012-12-31 14:00:00 | 2012 | 12 | 31 | 14:00 | Â | -1.7 | NaN | -4.7 | NaN | 80 | ... | NaN | 12.9 | NaN | 99.46 | NaN | NaN | NaN | -6 | NaN | NaN |
| 2012-12-31 15:00:00 | 2012 | 12 | 31 | 15:00 | Â | -0.9 | NaN | -3.8 | NaN | 81 | ... | NaN | 11.3 | NaN | 99.43 | NaN | NaN | NaN | -5 | NaN | NaN |
| 2012-12-31 16:00:00 | 2012 | 12 | 31 | 16:00 | Â | -0.7 | NaN | -3.1 | NaN | 84 | ... | NaN | 8.1 | NaN | 99.34 | NaN | NaN | NaN | -5 | NaN | Snow |
| 2012-12-31 17:00:00 | 2012 | 12 | 31 | 17:00 | Â | -0.8 | NaN | -3.0 | NaN | 85 | ... | NaN | 12.9 | NaN | 99.29 | NaN | NaN | NaN | -5 | NaN | Snow |
| 2012-12-31 18:00:00 | 2012 | 12 | 31 | 18:00 | Â | -0.6 | NaN | -3.1 | NaN | 83 | ... | NaN | 12.9 | NaN | 99.23 | NaN | NaN | NaN | -6 | NaN | Snow |
| 2012-12-31 19:00:00 | 2012 | 12 | 31 | 19:00 | Â | -0.6 | NaN | -3.0 | NaN | 84 | ... | NaN | 12.9 | NaN | 99.15 | NaN | NaN | NaN | -7 | NaN | Snow |
| 2012-12-31 20:00:00 | 2012 | 12 | 31 | 20:00 | Â | -0.8 | NaN | -2.7 | NaN | 87 | ... | NaN | 6.4 | NaN | 99.15 | NaN | NaN | NaN | -8 | NaN | Snow,Blowing Snow |
| 2012-12-31 21:00:00 | 2012 | 12 | 31 | 21:00 | Â | -0.7 | NaN | -2.8 | NaN | 86 | ... | NaN | 8.1 | NaN | 99.10 | NaN | NaN | NaN | -7 | NaN | Snow |
| 2012-12-31 22:00:00 | 2012 | 12 | 31 | 22:00 | Â | -0.5 | NaN | -2.7 | NaN | 85 | ... | NaN | 9.7 | NaN | 99.14 | NaN | NaN | NaN | -7 | NaN | Snow |
| 2012-12-31 23:00:00 | 2012 | 12 | 31 | 23:00 | Â | -1.1 | NaN | -4.3 | NaN | 79 | ... | NaN | 24.1 | NaN | 99.17 | NaN | NaN | NaN | -7 | NaN | NaN |
8784 rows × 24 columns
Of course, we still have to sanitize the data. The original defined function tried to do that, but the Ottawa data had some issues. A post-collection clean-up makes a little more sense to me anyway. Get the data, then manipulate it.
I’m make a copy of the data we aggregated first so I can show what happens if you simply use the dropna immediately.
backup = ott_weather_2012
ott_weather_2012 = ott_weather_2012.dropna(axis=1, how='any')
ott_weather_2012
| Year | Month | Day | Time | |
|---|---|---|---|---|
| Date/Time | ||||
| 2012-01-01 00:00:00 | 2012 | 1 | 1 | 00:00 |
| 2012-01-01 01:00:00 | 2012 | 1 | 1 | 01:00 |
| 2012-01-01 02:00:00 | 2012 | 1 | 1 | 02:00 |
| 2012-01-01 03:00:00 | 2012 | 1 | 1 | 03:00 |
| 2012-01-01 04:00:00 | 2012 | 1 | 1 | 04:00 |
| 2012-01-01 05:00:00 | 2012 | 1 | 1 | 05:00 |
| 2012-01-01 06:00:00 | 2012 | 1 | 1 | 06:00 |
| 2012-01-01 07:00:00 | 2012 | 1 | 1 | 07:00 |
| 2012-01-01 08:00:00 | 2012 | 1 | 1 | 08:00 |
| 2012-01-01 09:00:00 | 2012 | 1 | 1 | 09:00 |
| 2012-01-01 10:00:00 | 2012 | 1 | 1 | 10:00 |
| 2012-01-01 11:00:00 | 2012 | 1 | 1 | 11:00 |
| 2012-01-01 12:00:00 | 2012 | 1 | 1 | 12:00 |
| 2012-01-01 13:00:00 | 2012 | 1 | 1 | 13:00 |
| 2012-01-01 14:00:00 | 2012 | 1 | 1 | 14:00 |
| 2012-01-01 15:00:00 | 2012 | 1 | 1 | 15:00 |
| 2012-01-01 16:00:00 | 2012 | 1 | 1 | 16:00 |
| 2012-01-01 17:00:00 | 2012 | 1 | 1 | 17:00 |
| 2012-01-01 18:00:00 | 2012 | 1 | 1 | 18:00 |
| 2012-01-01 19:00:00 | 2012 | 1 | 1 | 19:00 |
| 2012-01-01 20:00:00 | 2012 | 1 | 1 | 20:00 |
| 2012-01-01 21:00:00 | 2012 | 1 | 1 | 21:00 |
| 2012-01-01 22:00:00 | 2012 | 1 | 1 | 22:00 |
| 2012-01-01 23:00:00 | 2012 | 1 | 1 | 23:00 |
| 2012-01-02 00:00:00 | 2012 | 1 | 2 | 00:00 |
| 2012-01-02 01:00:00 | 2012 | 1 | 2 | 01:00 |
| 2012-01-02 02:00:00 | 2012 | 1 | 2 | 02:00 |
| 2012-01-02 03:00:00 | 2012 | 1 | 2 | 03:00 |
| 2012-01-02 04:00:00 | 2012 | 1 | 2 | 04:00 |
| 2012-01-02 05:00:00 | 2012 | 1 | 2 | 05:00 |
| ... | ... | ... | ... | ... |
| 2012-12-30 18:00:00 | 2012 | 12 | 30 | 18:00 |
| 2012-12-30 19:00:00 | 2012 | 12 | 30 | 19:00 |
| 2012-12-30 20:00:00 | 2012 | 12 | 30 | 20:00 |
| 2012-12-30 21:00:00 | 2012 | 12 | 30 | 21:00 |
| 2012-12-30 22:00:00 | 2012 | 12 | 30 | 22:00 |
| 2012-12-30 23:00:00 | 2012 | 12 | 30 | 23:00 |
| 2012-12-31 00:00:00 | 2012 | 12 | 31 | 00:00 |
| 2012-12-31 01:00:00 | 2012 | 12 | 31 | 01:00 |
| 2012-12-31 02:00:00 | 2012 | 12 | 31 | 02:00 |
| 2012-12-31 03:00:00 | 2012 | 12 | 31 | 03:00 |
| 2012-12-31 04:00:00 | 2012 | 12 | 31 | 04:00 |
| 2012-12-31 05:00:00 | 2012 | 12 | 31 | 05:00 |
| 2012-12-31 06:00:00 | 2012 | 12 | 31 | 06:00 |
| 2012-12-31 07:00:00 | 2012 | 12 | 31 | 07:00 |
| 2012-12-31 08:00:00 | 2012 | 12 | 31 | 08:00 |
| 2012-12-31 09:00:00 | 2012 | 12 | 31 | 09:00 |
| 2012-12-31 10:00:00 | 2012 | 12 | 31 | 10:00 |
| 2012-12-31 11:00:00 | 2012 | 12 | 31 | 11:00 |
| 2012-12-31 12:00:00 | 2012 | 12 | 31 | 12:00 |
| 2012-12-31 13:00:00 | 2012 | 12 | 31 | 13:00 |
| 2012-12-31 14:00:00 | 2012 | 12 | 31 | 14:00 |
| 2012-12-31 15:00:00 | 2012 | 12 | 31 | 15:00 |
| 2012-12-31 16:00:00 | 2012 | 12 | 31 | 16:00 |
| 2012-12-31 17:00:00 | 2012 | 12 | 31 | 17:00 |
| 2012-12-31 18:00:00 | 2012 | 12 | 31 | 18:00 |
| 2012-12-31 19:00:00 | 2012 | 12 | 31 | 19:00 |
| 2012-12-31 20:00:00 | 2012 | 12 | 31 | 20:00 |
| 2012-12-31 21:00:00 | 2012 | 12 | 31 | 21:00 |
| 2012-12-31 22:00:00 | 2012 | 12 | 31 | 22:00 |
| 2012-12-31 23:00:00 | 2012 | 12 | 31 | 23:00 |
8784 rows × 4 columns
We lost the data we were interested in, but we already had a good idea this would happen. Apparently there was a lot of missing data in 2012, or at least enough to trigger the column to be dropped. Dropping the redundant rows at this point would only leave us with a time series for the year. Not terribly interesting.
Restoring to our saved data, we can use a slightly different methodology to get the data that has values. We can just drop the rows where the temperature has no value. We should see how many rows we have before and after to see if there was a significant amount of data lost. Significant is left as an exercise for the person doing the work.
Depending on how that turned out, do we trust the data set now?
ott_weather_2012 = backup
Using the dataframe shape function, we can get the size of the data frame.
ott_weather_2012.shape
(8784, 24)
The first column is the number of rows. We have a lot of rows.
Sanitizing the data, uses a few manipulations. Since we really only care about the temperature, we can effectively drop all the other columns. That isn’t quite as easy as it sounds, we would either have to use indices or names and that was already looked at.
The following could be a function, but I’m not bothering at this point. I just want sanitized data.
# get rid of the wierd characters
ott_weather_2012.rename(columns = {u"Temp (\xc2\xb0C)":u'Temp (C)',
                                   u"Dew Point Temp (\xc2\xb0C)":u'Dew Point Temp (C)'},
                        inplace = True)
# since we are only interested in the temperature, let's extract only the rows that have temperature entries
ott_weather_2012 = ott_weather_2012[np.isfinite(ott_weather_2012['Temp (C)'])]
# drop the redundant data
ott_weather_2012 = ott_weather_2012.drop(['Year', 'Day', 'Month', 'Time', 'Data Quality'], axis=1)
# drop columns with useless data. We know from above that our Temp (C) column is fully populated
ott_weather_2012 = ott_weather_2012.dropna(axis=1, how='any')
Since we have sanitized, we should check the dataframe again
ott_weather_2012.shape
(8719, 2)
We only have two columns now, so many were dropped with the dropna function. We also have a reduced number of rows. At the time I wrote this, we reduced the row count by 65 rows or roughly 0.8%. Since we are only doing hourly data, this is does not appear to be terribly significant, however we should check for large gaps in the data. If these all occurred together, we would have close to a three day data gap that needed explanation.
Our new data frame looks like this now.
ott_weather_2012
| Temp (C) | Visibility (km) | |
|---|---|---|
| Date/Time | ||
| 2012-01-01 00:00:00 | -3.8 | 10.0 |
| 2012-01-01 01:00:00 | -3.9 | 10.0 |
| 2012-01-01 02:00:00 | -3.9 | 10.0 |
| 2012-01-01 03:00:00 | -3.9 | 6.4 |
| 2012-01-01 04:00:00 | -3.9 | 4.8 |
| 2012-01-01 05:00:00 | -3.8 | 8.1 |
| 2012-01-01 06:00:00 | -3.7 | 9.7 |
| 2012-01-01 07:00:00 | -3.6 | 9.7 |
| 2012-01-01 08:00:00 | -3.4 | 4.8 |
| 2012-01-01 09:00:00 | -2.9 | 4.8 |
| 2012-01-01 10:00:00 | -2.3 | 4.8 |
| 2012-01-01 11:00:00 | -1.7 | 3.2 |
| 2012-01-01 12:00:00 | -0.7 | 1.6 |
| 2012-01-01 13:00:00 | 0.1 | 2.4 |
| 2012-01-01 14:00:00 | 0.7 | 4.8 |
| 2012-01-01 15:00:00 | 0.7 | 6.4 |
| 2012-01-01 16:00:00 | 0.3 | 4.8 |
| 2012-01-01 17:00:00 | 0.1 | 4.8 |
| 2012-01-01 18:00:00 | 0.2 | 4.8 |
| 2012-01-01 19:00:00 | 1.4 | 8.1 |
| 2012-01-01 20:00:00 | 1.8 | 8.1 |
| 2012-01-01 21:00:00 | 4.7 | 10.0 |
| 2012-01-01 22:00:00 | 4.6 | 10.0 |
| 2012-01-01 23:00:00 | 4.0 | 10.0 |
| 2012-01-02 00:00:00 | 3.7 | 10.0 |
| 2012-01-02 01:00:00 | 2.9 | 10.0 |
| 2012-01-02 02:00:00 | 2.3 | 10.0 |
| 2012-01-02 03:00:00 | 1.8 | 10.0 |
| 2012-01-02 04:00:00 | 1.7 | 10.0 |
| 2012-01-02 05:00:00 | 1.4 | 10.0 |
| ... | ... | ... |
| 2012-12-30 18:00:00 | -13.1 | 24.1 |
| 2012-12-30 19:00:00 | -12.4 | 24.1 |
| 2012-12-30 20:00:00 | -12.3 | 24.1 |
| 2012-12-30 21:00:00 | -11.3 | 24.1 |
| 2012-12-30 22:00:00 | -10.8 | 24.1 |
| 2012-12-30 23:00:00 | -10.9 | 24.1 |
| 2012-12-31 00:00:00 | -10.5 | 4.8 |
| 2012-12-31 01:00:00 | -11.1 | 12.9 |
| 2012-12-31 02:00:00 | -10.7 | 24.1 |
| 2012-12-31 03:00:00 | -10.3 | 24.1 |
| 2012-12-31 04:00:00 | -10.0 | 24.1 |
| 2012-12-31 05:00:00 | -9.7 | 24.1 |
| 2012-12-31 06:00:00 | -8.7 | 24.1 |
| 2012-12-31 07:00:00 | -8.5 | 24.1 |
| 2012-12-31 08:00:00 | -8.6 | 16.1 |
| 2012-12-31 09:00:00 | -8.3 | 16.1 |
| 2012-12-31 10:00:00 | -6.9 | 16.1 |
| 2012-12-31 11:00:00 | -3.5 | 16.1 |
| 2012-12-31 12:00:00 | -2.5 | 16.1 |
| 2012-12-31 13:00:00 | -2.1 | 12.9 |
| 2012-12-31 14:00:00 | -1.7 | 12.9 |
| 2012-12-31 15:00:00 | -0.9 | 11.3 |
| 2012-12-31 16:00:00 | -0.7 | 8.1 |
| 2012-12-31 17:00:00 | -0.8 | 12.9 |
| 2012-12-31 18:00:00 | -0.6 | 12.9 |
| 2012-12-31 19:00:00 | -0.6 | 12.9 |
| 2012-12-31 20:00:00 | -0.8 | 6.4 |
| 2012-12-31 21:00:00 | -0.7 | 8.1 |
| 2012-12-31 22:00:00 | -0.5 | 9.7 |
| 2012-12-31 23:00:00 | -1.1 | 24.1 |
8719 rows × 2 columns
Saving the data to a CSV
It’s slow and unnecessary to download the data every time, so we should save our dataframe for later use. In reality, we should have saved the full set for the year, just in case we wanted to use other columns in the future.
ott_weather_2012.to_csv('./data/ott_weather_2012.csv')
Data saved. Just for fun, using the saved data, we can plot the data for the year. This looks suspiciously like the first graph.
ott_weather_2012_final = pd.read_csv('data/ott_weather_2012.csv', index_col='Date/Time', encoding='latin1')
chart = ott_weather_2012_final['Temp (C)'].plot(figsize=(15, 6))
chart.set_xlabel("Date/Time")
<matplotlib.text.Text at 0x110fe84d0>
